Linux 性能监测:Network
2009年11月21日 | 标签: linux, monitoring, performance | 作者:vpsee
网络的监测是所有 Linux 子系统里面最复杂的,有太多的因素在里面,比如:延迟、阻塞、冲突、丢包等,更糟的是与 Linux 主机相连的路由器、交换机、无线信号都会影响到整体网络并且很难判断是因为 Linux 网络子系统的问题还是别的设备的问题,增加了监测和判断的复杂度。现在我们使用的所有网卡都称为自适应网卡,意思是说能根据网络上的不同网络设备导致的不同网络速度和工作模式进行自动调整。我们可以通过 ethtool 工具来查看网卡的配置和工作模式:
# /sbin/ethtool eth0
Settings for eth0:
	Supported ports: [ TP ]
	Supported link modes:   10baseT/Half 10baseT/Full
	                        100baseT/Half 100baseT/Full
	                        1000baseT/Half 1000baseT/Full
	Supports auto-negotiation: Yes
	Advertised link modes:  10baseT/Half 10baseT/Full
	                        100baseT/Half 100baseT/Full
	                        1000baseT/Half 1000baseT/Full
	Advertised auto-negotiation: Yes
	Speed: 100Mb/s
	Duplex: Full
	Port: Twisted Pair
	PHYAD: 1
	Transceiver: internal
	Auto-negotiation: on
	Supports Wake-on: g
	Wake-on: g
	Current message level: 0x000000ff (255)
	Link detected: yes
上面给出的例子说明网卡有 10baseT,100baseT 和 1000baseT 三种选择,目前正自适应为 100baseT(Speed: 100Mb/s)。可以通过 ethtool 工具强制网卡工作在 1000baseT 下:
# /sbin/ethtool -s eth0 speed 1000 duplex full autoneg off
iptraf
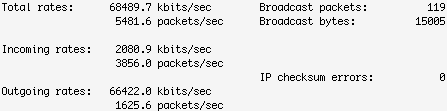
两台主机之间有网线(或无线)、路由器、交换机等设备,测试两台主机之间的网络性能的一个办法就是在这两个系统之间互发数据并统计结果,看看吞吐量、延迟、速率如何。iptraf 就是一个很好的查看本机网络吞吐量的好工具,支持文字图形界面,很直观。下面图片显示在 100 mbps 速率的网络下这个 Linux 系统的发送传输率有点慢,Outgoing rates 只有 66 mbps.
# iptraf -d eth0
netperf
netperf 运行在 client/server 模式下,比 iptraf 能更多样化的测试终端的吞吐量。先在服务器端启动 netserver:
# netserver
Starting netserver at port 12865
Starting netserver at hostname 0.0.0.0 port 12865 and family AF_UNSPEC
然后在客户端测试服务器,执行一次持续10秒的 TCP 测试:
# netperf -H 172.16.38.36 -l 10
TCP STREAM TEST from 0.0.0.0 (0.0.0.0) port 0 AF_INET to 172.16.38.36 (172.16.38.36) port 0 AF_INET
Recv   Send    Send
Socket Socket  Message  Elapsed
Size   Size    Size     Time     Throughput
bytes  bytes   bytes    secs.    10^6bits/sec

 87380  16384  16384    10.32      93.68
从以上输出可以看出,网络吞吐量在 94mbps 左右,对于 100mbps 的网络来说这个性能算的上很不错。上面的测试是在服务器和客户端位于同一个局域网,并且局域网是有线网的情况,你也可以试试不同结构、不同速率的网络,比如:网络之间中间多几个路由器、客户端在 wi-fi、VPN 等情况。
netperf 还可以通过建立一个 TCP 连接并顺序地发送数据包来测试每秒有多少 TCP 请求和响应。下面的输出显示在 TCP requests 使用 2K 大小,responses 使用 32K 的情况下处理速率为每秒243:
# netperf -t TCP_RR -H 172.16.38.36 -l 10 -- -r 2048,32768
TCP REQUEST/RESPONSE TEST from 0.0.0.0 (0.0.0.0) port 0 AF_INET to 172.16.38.36 (172.16.38.36) port 0 AF_INET
Local /Remote
Socket Size   Request  Resp.   Elapsed  Trans.
Send   Recv   Size     Size    Time     Rate
bytes  Bytes  bytes    bytes   secs.    per sec

16384  87380  2048     32768   10.00     243.03
16384  87380
iperf
iperf 和 netperf 运行方式类似,也是 server/client 模式,先在服务器端启动 iperf:
# iperf -s -D
------------------------------------------------------------
Server listening on TCP port 5001
TCP window size: 85.3 KByte (default)
------------------------------------------------------------
Running Iperf Server as a daemon
The Iperf daemon process ID : 5695
然后在客户端对服务器进行测试,客户端先连接到服务器端(172.16.38.36),并在30秒内每隔5秒对服务器和客户端之间的网络进行一次带宽测试和采样:
# iperf -c 172.16.38.36 -t 30 -i 5
------------------------------------------------------------
Client connecting to 172.16.38.36, TCP port 5001
TCP window size: 16.0 KByte (default)
------------------------------------------------------------
[  3] local 172.16.39.100 port 49515 connected with 172.16.38.36 port 5001
[ ID] Interval       Transfer     Bandwidth
[  3]  0.0- 5.0 sec  58.8 MBytes  98.6 Mbits/sec
[ ID] Interval       Transfer     Bandwidth
[  3]  5.0-10.0 sec  55.0 MBytes  92.3 Mbits/sec
[ ID] Interval       Transfer     Bandwidth
[  3] 10.0-15.0 sec  55.1 MBytes  92.4 Mbits/sec
[ ID] Interval       Transfer     Bandwidth
[  3] 15.0-20.0 sec  55.9 MBytes  93.8 Mbits/sec
[ ID] Interval       Transfer     Bandwidth
[  3] 20.0-25.0 sec  55.4 MBytes  92.9 Mbits/sec
[ ID] Interval       Transfer     Bandwidth
[  3] 25.0-30.0 sec  55.3 MBytes  92.8 Mbits/sec
[ ID] Interval       Transfer     Bandwidth
[  3]  0.0-30.0 sec    335 MBytes  93.7 Mbits/sec
tcpdump 和 tcptrace
tcmdump 和 tcptrace 提供了一种更细致的分析方法,先用 tcpdump 按要求捕获数据包把结果输出到某一文件,然后再用 tcptrace 分析其文件格式。这个工具组合可以提供一些难以用其他工具发现的信息:
# /usr/sbin/tcpdump -w network.dmp
tcpdump: listening on eth0, link-type EN10MB (Ethernet), capture size 96 bytes
511942 packets captured
511942 packets received by filter
0 packets dropped by kernel

# tcptrace network.dmp
1 arg remaining, starting with 'network.dmp'
Ostermann's tcptrace -- version 6.6.7 -- Thu Nov  4, 2004

511677 packets seen, 511487 TCP packets traced
elapsed wallclock time: 0:00:00.510291, 1002714 pkts/sec analyzed
trace file elapsed time: 0:02:35.836372
TCP connection info:
  1: zaber:54581 - boulder:111 (a2b)                   6>    5<  (complete)
  2: zaber:833 - boulder:32774 (c2d)                   6>    5<  (complete)
  3: zaber:pcanywherestat - 172.16.39.5:53086 (e2f)    2>    3<
  4: zaber:716 - boulder:2049 (g2h)                  347>  257<
  5: 172.16.39.100:58029 - zaber:12865 (i2j)           7>    5<  (complete)
  6: 172.16.39.100:47592 - zaber:36814 (k2l)        255380> 255378<  (reset)
  7: breakpoint:45510 - zaber:7012 (m2n)               9>    5<  (complete)
  8: zaber:35813 - boulder:111 (o2p)                   6>    5<  (complete)
  9: zaber:837 - boulder:32774 (q2r)                   6>    5<  (complete)
 10: breakpoint:45511 - zaber:7012 (s2t)               9>    5<  (complete)
 11: zaber:59362 - boulder:111 (u2v)                   6>    5<  (complete)
 12: zaber:841 - boulder:32774 (w2x)                   6>    5<  (complete)
 13: breakpoint:45512 - zaber:7012 (y2z)               9>    5<  (complete)
tcptrace 功能很强大,还可以通过过滤和布尔表达式来找出有问题的连接,比如,找出转播大于100 segments 的连接:
# tcptrace -f'rexmit_segs>100' network.dmp
如果发现连接 #10 有问题,可以查看关于这个连接的其他信息:
# tcptrace -o10 network.dmp
下面的命令使用 tcptrace 的 slice 模式,程序自动在当前目录创建了一个 slice.dat 文件,这个文件包含了每隔15秒的转播信息:
# tcptrace -xslice network.dmp

# cat slice.dat
date                segs    bytes  rexsegs rexbytes      new   active
--------------- -------- -------- -------- -------- -------- --------
16:58:50.244708    85055  4513418        0        0        6        6
16:59:05.244708   110921  5882896        0        0        0        2
16:59:20.244708   126107  6697827        0        0        1        3
16:59:35.244708   151719  8043597        0        0        0        2
16:59:50.244708    37296  1980557        0        0        0        3
17:00:05.244708       67     8828        0        0        2        3
17:00:20.244708      149    22053        0        0        1        2
17:00:35.244708       30     4080        0        0        0        1
17:00:50.244708       39     5688        0        0        0        1
17:01:05.244708       67     8828        0        0        2        3
17:01:11.081080       37     4121        0        0        1        3
Linux 性能监测:介绍
Linux 性能监测:CPU
Linux 性能监测:Memory
Linux 性能监测:IO
Linux 性能监测:工具