使用 Grafana+collectd+InfluxDB 打造现代监控系统
2015年03月19日 | 标签: collectd, grafana, influxdb | 作者:vpsee
想打造 New Relic 那样漂亮的实时监控系统我们只需要 InfluxDB/collectd/Grafana 这三个工具,这三个工具的关系是这样的:
采集数据(collectd)-> 存储数据(InfluxDB) -> 显示数据(Grafana)。
- InfluxDB 是 Go 语言开发的一个开源分布式时序数据库,非常适合存储指标、事件、分析等数据,看版本号(v0.8.8)就知道这个项目还很年轻;
- collectd 就不用介绍了吧,C 语言写的一个系统性能采集工具;
- Grafana 是纯 Javascript 开发的前端工具,用于访问 InfluxDB,自定义报表、显示图表等。
下面的安装和配置步骤在 Ubuntu 14.04 Server 64bit 版上完成。升级整个系统后重启:
$ sudo apt-get update
$ sudo apt-get upgrade
$ sudo reboot
安装 InfluxDB
InfluxDB 是 Go 写的,不依赖任何其他包或库,很干净。安装很容易:
$ wget https://s3.amazonaws.com/influxdb/influxdb_latest_amd64.deb
$ sudo dpkg -i influxdb_latest_amd64.deb
启动 InfluxDB:
$ sudo /etc/init.d/influxdb start
Setting ulimit -n 65536
Starting the process influxdb [ OK ]
influxdb process was started [ OK ]
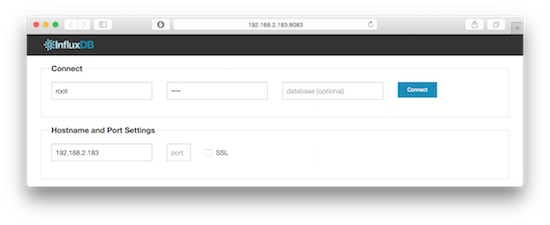
启动后打开 web 管理界面 http://192.168.2.183:8083/ 默认用户名和密码是 root 和 root. InfluxDB 的 Web 管理界面端口是 8083,HTTP API 监听端口是 8086,如果需要更改这些默认设定,修改 InfluxDB 的配置文件重启就可以了。
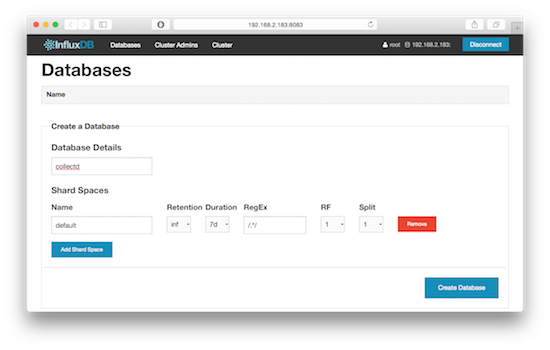
在刚安装好的 InfluxDB 上创建一个名为 collectd 的数据库,可以用命令行创建,也可以用 Web 管理界面操作:
$ curl "http://192.168.2.183:8086/db?u=root&p=root" -d "{\"name\": \"collectd\"}"
安装 collectd
安装 collectd:
$ sudo apt-get install collectd
配置 collectd 为客户端,收集到数据后直接发给 InfluxDB:
$ sudo vi /etc/collectd/collectd.conf
...
LoadPlugin network
...
<Plugin network>
        Server "192.168.2.183" "25826"
</Plugin>
...
重启 collectd:
$ sudo /etc/init.d/collectd restart
InfluxDB 现在自带一个 collectd 插件来获取 collectd 客户端发来的数据,以前可没这么方便哦,0.8.4 版本以前只能通过 influxdb-collectd-proxy 这样的第三方程序来连接 collectd 和 InfluxDB. 如果你检查一下服务器上打开的端口就会发现 influxdb 插件启动了一个 25826 端口,如果发现 InfluxDB 数据库里没有(收集到)数据,务必检查这个 25826 端口是否正常启动了:
$ sudo netstat -tupln
Active Internet connections (only servers)
Proto Recv-Q Send-Q Local Address           Foreign Address         State       PID/Program name
tcp        0      0 0.0.0.0:22              0.0.0.0:*               LISTEN      622/sshd
tcp6       0      0 :::8086                 :::*                    LISTEN      668/influxdb
tcp6       0      0 :::22                   :::*                    LISTEN      622/sshd
tcp6       0      0 :::8090                 :::*                    LISTEN      668/influxdb
tcp6       0      0 :::8099                 :::*                    LISTEN      668/influxdb
tcp6       0      0 :::8083                 :::*                    LISTEN      668/influxdb
udp6       0      0 :::25826                :::*                                668/influxdb
InfluxDB 自带的 collectd 插件默认是关闭的,需要手动配置打开 enabled = true,并填上 database = “collectd” 这一行,这里的 “collectd” 就是我们上面创建的那个数据库,更改配置后记得重启 InfluxDB:
$ sudo vi /opt/influxdb/current/config.toml
$ sudo vi /opt/influxdb/shared/config.toml
...
  # Configure the collectd api
  [input_plugins.collectd]
  enabled = true
  # address = "0.0.0.0" # If not set, is actually set to bind-address.
  # port = 25826
  database = "collectd"
  # types.db can be found in a collectd installation or on github:
  # https://github.com/collectd/collectd/blob/master/src/types.db
  # typesdb = "/usr/share/collectd/types.db" # The path to the collectd types.db file
...

$ sudo /etc/init.d/influxdb restart
Setting ulimit -n 65536
Setting ulimit -n 65536
influxdb process was stopped [ OK ]
Setting ulimit -n 65536
Starting the process influxdb [ OK ]
influxdb process was started [ OK ]
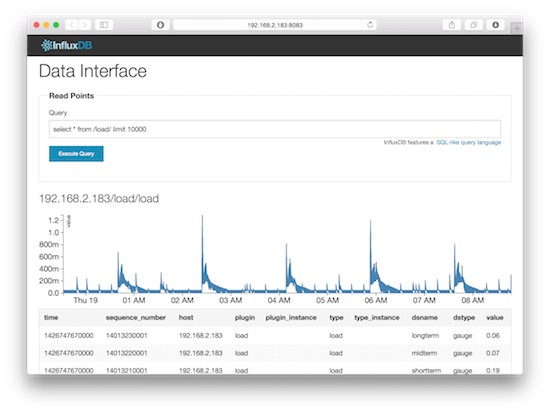
现在 InfluxDB 已经准备好接受和处理 collectd 传来的数据了。用命令行或者 Web 管理界面验证一下数据库里是否有数据:
$ curl -G 'http://192.168.2.183:8086/db/collectd/series?u=root&p=root&q=list+series&pretty=true'
[
    {
        "name": "list_series_result",
        "columns": [
            "time",
            "name"
        ],
        "points": [
            [
                0,
                "192.168.2.183/cpu-0/cpu-idle"
            ],
...
        ]
    }
]
安装 Grafana
下载 grafana 后解压发到 web 服务器上就可用。这里省去配置 Nginx/Apache 之类的麻烦,直接用最简单的 Web 服务器 python -m SimpleHTTPServer 驱动:
$ wget http://grafanarel.s3.amazonaws.com/grafana-1.9.1.tar.gz
$ tar xzvf grafana-1.9.1.tar.gz
$ cd grafana-1.9.1.tar.gz
$ cp config.sample.js config.js

$ vi config.js
...
      // InfluxDB example setup (the InfluxDB databases specified need to exist)
      datasources: {
        influxdb: {
          type: 'influxdb',
          url: "http://192.168.2.183:8086/db/collectd",
          username: 'root',
          password: 'root',
        },
        ...
      },
...

$ sudo python -m SimpleHTTPServer
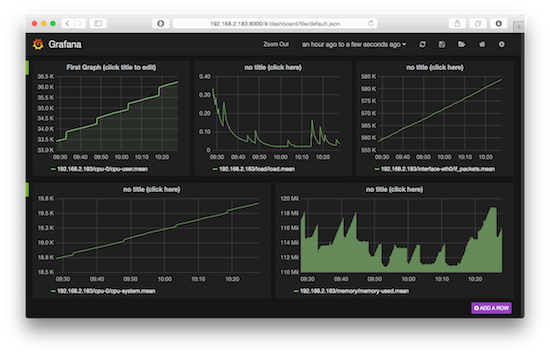
用浏览器访问 Grafana,这里的默认端口是 8000:
Troubleshooting
下面有多个网友评论提到修改配置文件后端口 25826 也无法起来的问题,和 influxdb 启动时候使用的是哪个配置文件有关,用 ps aux | grep influxdb 可以看到当前 influxdb 使用的是哪个配置文件:
$ sudo vi /opt/influxdb/current/config.toml
$ sudo vi /opt/influxdb/shared/config.toml

$ ps aux | grep influxdb
influxdb   668 19.1  8.1 2655964 82336 ?       Sl   Mar31 6375:52 /usr/bin/influxdb -pidfile /opt/influxdb/shared/influxdb.pid -config /opt/influxdb/shared/config.toml
...
两个配置文件 /opt/influxdb/current/config.toml 和 /opt/influxdb/shared/config.toml 的确很坑爹~
influxdb有待进一步成熟..
influxdb + diamond + grafana也是不错的组合
数据量过大后,InfluxDB性能就是瓶颈了
HBase也是一种时序数据库
@沐然的爸爸
为什么这么说?
influxdb不是分布式数据库吗?应该可以load balance吧?
有遇到:端口25826 没有起来 这个问题吗?
谢谢啊。
LS请打开upd server,配置为true
遇到同样的问题,25826端口没生效。
能把主要配置文件贴出来吗,influxdb 0.8.8 .
问题同上, 无法打开 25826
25826 怎样才能打开
/etc/services 里面配置了
influxdb 25826/tcp # common
influxdb 25826/udp # common
也不造啊~
在 influxdb 配置文件里把插件 enable 以后,然后重启 influxdb 就应该能启动 25826 端口了。
[input_plugins.collectd]
enabled = true
如果端口不通的话看看是否重启了 influxdb,是否防火墙屏蔽了端口,查看日志文件 /opt/influxdb/shared/log.* 里面的出错信息。
我发现是配置问题的原因,运行 ps aux | grep influxdb 我的情况,配置文件是 /opt/influxdb/shared/config.toml 而不是 /opt/influxdb/current/config.toml
@wdxz
呵呵,被你发现了~难怪楼上几个朋友抱怨 25826 端口没有启动。除了 /opt/influxdb/current/config.toml 还有个 /opt/influxdb/shared/config.toml,两个一样的配置文件的确很坑爹,开发人员本意可能是想做一个 current/config.toml -> shard/config.toml 链接。
奇怪,为什么我的还是不行呢?
collectd 取出来的数据都不带单位,需要自己到Grafana里选择单位,问题是很多参数我都不知道它的具体单位是什么,比如 cpu wait 和 server load,而且无法显示memory的使用百分比,有没有什么办法用这套工具做到像newrelic那样呢?
@abug
嗯,这个是挺麻烦的,需要参考 collectd 相关文档了解某个参数的意义,然后在 grafana 里调整相应的参数单位。
influxdb 0.8.8 在ubuntu12.04试了各种方式都不能打开25826端口。
请教高手怎么办
找到25826启动不了的原因了,必须把下边这行的注释#去掉
typesdb = “/usr/share/collectd/types.db”
OPENTSDB配合grafana也很棒。
请问楼主有influxdb分布式部署的资料吗,请教具体怎么配置
按照文章没有部署成功,端口都能起来,但是数据collectd不给influxdb发送数据
请问opentsdb+grafana用过么?这个怎么搞
请问influxdb&grafana服务器系统时区是CST吗?我现在遇到在grafana上查询数据时查询的不是当前的数据而是8小时以后的数据导致界面显示“no datapoint”的问题。难道必须使用UTC时区吗?
版本之间有兼容性吧
influxdb 0.9.6.1
collectd 5.4.2
获取不到数据。
我的collectd启动出现了问题,配置文件不知道需要修改成什么样子,启动指令没有作用,启动之后没有collectd的进程,另外,我无法找到influxdb的那个配置文件,反而找到了influxdb.conf的配置文件,请问应该怎么解决?
centos 和 ubuntu 系统默认端口范围为 32768~60999
可以修改 /etc/sysctl.conf net.ipv4.ip_local_port_range start end 来启用